Bitcoin Price Prediction: BTC/USD Couldn’t Breakout; Price Remains Below $64,800

Bitcoin (BTC) Price Prediction – April 14
At the moment, BTC/USD drops by a total of 2.46% within the last few hours as it trades at the $62,024 level.
BTC/USD Long-term Trend: Bullish (Daily Chart)
Key levels:
Resistance Levels: $68,000, $70,000, $72,000
Support Levels: $58,000, $56,000, $54,000
The daily chart reveals that BTC/USD couldn’t trade above the upper boundary of the ascending channel as it fails to close above the $64,896 resistance. The Bitcoin (BTC) begins the day off by trending higher toward the $65,000 level only to fall back and slides toward the 9-day and 21-day moving averages. Similarly, the first level of support is located at $62,000. Beneath this, support lies at $58,000, $56,000, and $54,000 levels.
What to Expect From Bitcoin (BTC)
The daily chart reveals that Bitcoin has failed to break above this ascending channel as it looks to set up another few days of negative price declines beneath $62,500. A break above this channel would have set Bitcoin up to reach the $65,000 resistance level but instead, the king coin slides below the daily high.
However, BTC/USD is strongly supported at the various former resistance levels include $61,000 and $60,000. More so, bulls are also banking on the moving averages to ensure that in spite of a reversal, the Bitcoin price stays above the $60,000 level. Moreover, if the first digital asset decides to trade above the upper boundary of the channel, the nearest resistance levels could be located at $68,000, $70,000, and $72,000 respectively. Meanwhile, the RSI (14) is seen dropping below 65-level, which may give some bearish signals.
BTC/USD Medium-Term Trend: Bullish (4H Chart)
The 4-hour chart shows that the Bitcoin bears are now stepping back into the market pushing the BTC price below its previous support level that existed around $62,200. Although the Bitcoin price has not yet slipped below $61,000, it’s still in the loop of making a bounce back and trade above the $62,000 level. Presently, the Bitcoin price hovers around $62,078.09 and may take time to persistently trade above $64,800.
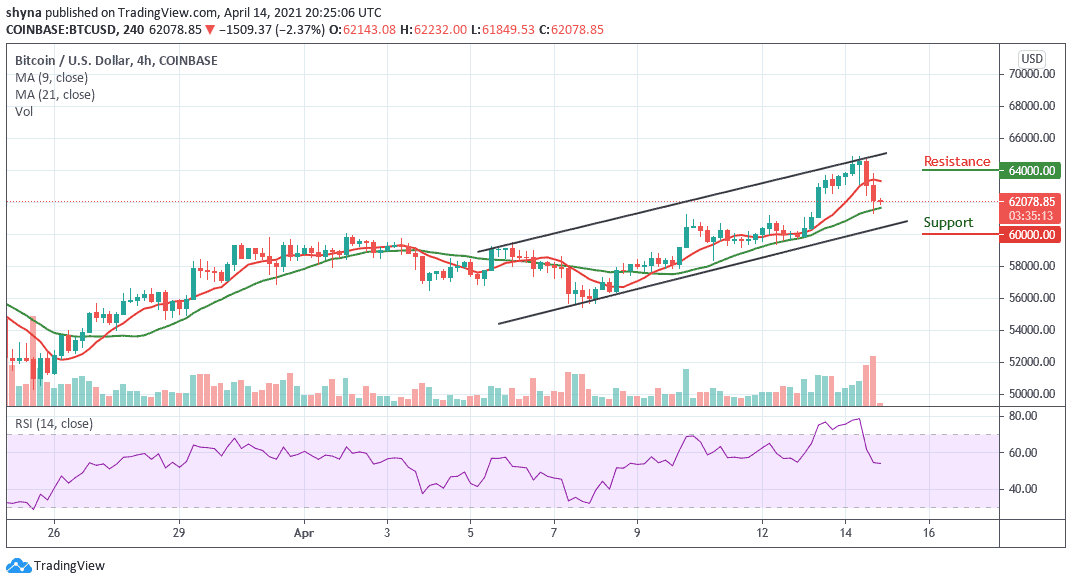
In addition, BTC/USD is within the 9-day and 21-day moving averages but the upward movement may likely push the price to the nearest resistance at $64,000 and above while the immediate support lies at $60,000 and below. Meanwhile, the RSI (14) is moving below the 60-level, which indicates more bearish signals may come into play.


