Bitcoin (BTC) Price Prediction: BTC/USD Declines as Bitcoin Slides below $40,000

Bitcoin Bulls Fails to Sustain Recent Rallies as Bitcoin Slides below $40,000– July 31, 2021
Soon after the July 31 uptrend, Bitcoin price rallied to $42,400 and the price movement becomes insignificant. The king coin would have resumed upside momentum if the bulls have broken the $40,000 to $42,451 resistance zones convincingly. On the upside, if Bitcoin rebounds above the 21-day SMA support, the market will rise and rally above the $42,451 resistance level. This will signal the resumption of the uptrend. BTC/USD will reach its target price of $45,000. On the other hand, Bitcoin will fall as the market reaches the overbought region. The downtrend will resume to the low of $36,000. The downtrend will terminate if it founds support above the moving averages.
Bitcoin (BTC) Indicator Reading
Bitcoin is below the 80% range of the daily Stochastic. It indicates that the altcoin is in a bearish momentum as the market resumes downward. BTC price is at level 71 of the Relative Strength Index period 14. It indicates that Bitcoin is in the overbought region and the coin has no room to rally on the upside. BTC price is above the moving averages which suggest that the king coin is in the bullish trend zone.
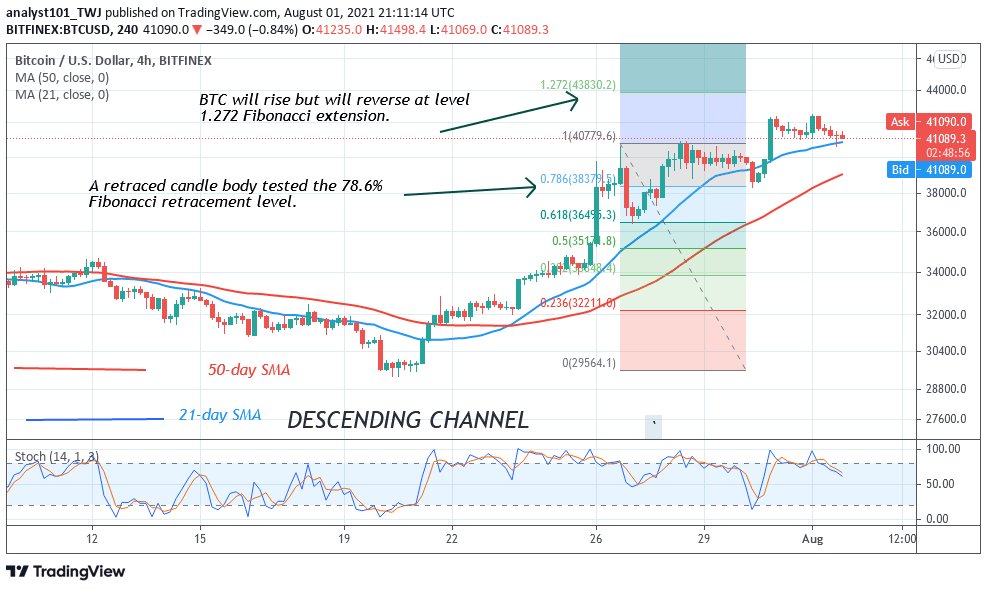
Meanwhile, the BTC/USD price is retracing from the recent high as Bitcoin slides below $40,000. BTC price is confined in a tight range. The selling pressure will resume if the lower price range is breached. Meanwhile, on July 26 uptrend; a retraced candle body tested the 78.6% Fibonacci retracement level. The retracement indicates that Bitcoin will rise but reverse at level 1.272 Fibonacci extension or level $43,830.20.
Looking to buy or trade Bitcoin (BTC) now? Invest at eToro!
75% of retail investor accounts lose money when trading CFDs with this provider


