Bitcoin (BTC/USD) Market Heightens Correction at $50,000

Bitcoin Price Prediction – December 13
It noticed that the BTC/USD market heightens correction after hitting resistance around $50,000. The crypto trade’s percentage rate gets increased by a negative number of 4.32 to trade around $48,229 as of writing.
BTC/USD Market
Key Levels:
Resistance levels: $52,500, $55,000, $57,500
Support levels: $45,000, $42,500, $40,000
BTC/USD – Daily Chart
The BTC/USD daily chart showcases that the crypto-coin market heightens correction around $50,000 when hitting a resistance a bit above the value-line during yesterday’s session. The 14-day SMA trend line has faintly moved to the south side of the 50-day SMA trend line a bit below $55,000. The bearish channel trend lines drew to take note of the range within which the correction moves. The Stochastic Oscillators have swerved the lines opened against the range of 40. That indicates a sudden lapse in the upward forces that price recently embarked.
Is there still been an indication suggesting further depressions in the BTC/USD price valuation as the crypto market heightens a correction at $50,000?
There are still potentialities that more depressive pushes will occur in the BTC/USD operation as the crypto-economic market heightens correction at $50,000 currently. The affirmation of price correction may again lead the trading activities back down to a lowly-previous zone. The support level at $45,000 remains a critical lower trading zone. A rebounding motion tends to re-feature in no time, possibly before reaching the support level.
On the contrary, accounting for the upside technical analysis, the BTC/USD market short-position takers needed to hold their positions firm between $50,000 and $45,000 to be able to push the market further down beyond the lower value-line. But, a lot of cautiousness has to exercise while exerting a sell order around the smaller point. 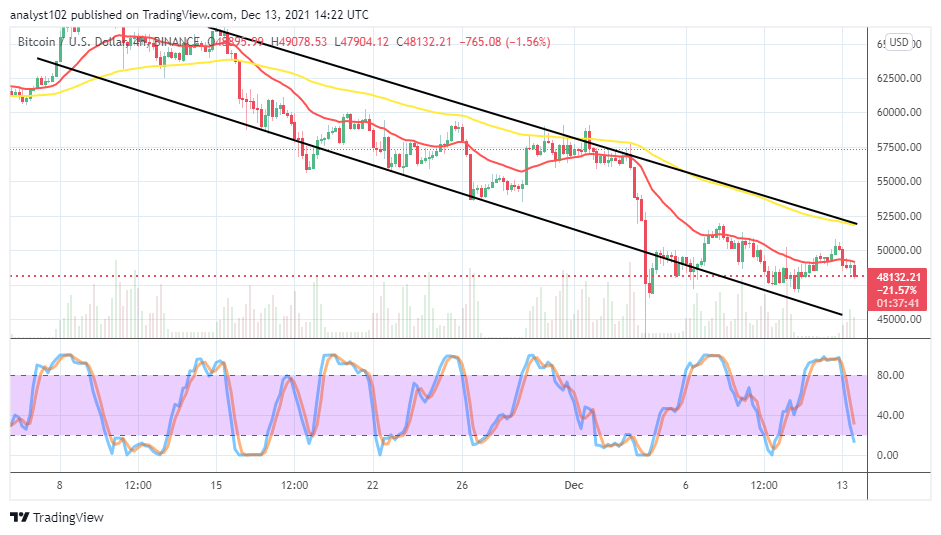
BTC/USD 4-hour Chart
The BTC/USD medium-term chart showcases that the crypto-economic market heightens correction while several 4-hour candlesticks has emerged against the smaller indicator to the down side. The 50-day SMA trend line is above the 14-day SMA trend line. The Stochastic Oscillators have just freshly moved down into the oversold region, indicating the possibility of getting re-energized around the previous lower trading spot at $47,500. A long consolidation of price around the value line will portend an ugly situation for achieving an upswing.
Looking to buy or trade Bitcoin (BTC) now? Invest at eToro!
68% of retail investor accounts lose money when trading CFDs with this provider.
Read more:
- How to buy Bitcoin
- How to buy cryptocurrency


