Bitcoin Price Prediction: BTC/USD Bears Demolish $38,000 Support

Bitcoin Price Prediction – August 5
The Bitcoin price prediction shows that BTC remains below the moving averages, trading at $53,366 support.
BTC/USD Long-term Trend: Bearish (Daily Chart)
Key levels:
Resistance Levels: $44,000, $46,000 $48,000
Support Levels: $34,000, $32,000, $30,000
BTC/USD is currently facing a setback as this current movement might be a permanent one. The coin is likely to have a bearish movement in the short-term but a price rally may help the coin to touch its daily low. Currently, Bitcoin (BTC) is trading around $37,970 level after a free fall from $39,831.
Bitcoin Price Prediction: Can Bitcoin Price Touch $40k High?
According to the daily chart, the Bitcoin price may touch the low of $37,000 today, if the price slump towards the 21-day moving averages, the $35,000 mark could be a critical zone to keep an eye on as moving towards the lower boundary of the channel could take the price to the supports at $34,000, $32,000, and $30,000, making room for BTC to fall even further.
On the contrary, the technical indicator Relative Strength Index (14) for the signal line nosedives below 50-level as trading volume is fading out. Therefore, if the king coin decides to move the price above the moving averages; Bitcoin price may see resistance levels at $44,000, $42,000, and $40,000. Nevertheless, the Bitcoin price is expected to bounce back above $42,000 in order to complete the second part of its correction.
BTC/USD Medium-term Trend: Bearish (4H Chart)
According to the 4-hour chart, the Bitcoin price is slumping below the 9-day and 21-day moving averages to touch the low of $36,000. After this sudden fall, the coin started picking again to where it’s trading currently at $37,694. Therefore, should the market price drops further; it could reach the nearest support at $36,000 and below.
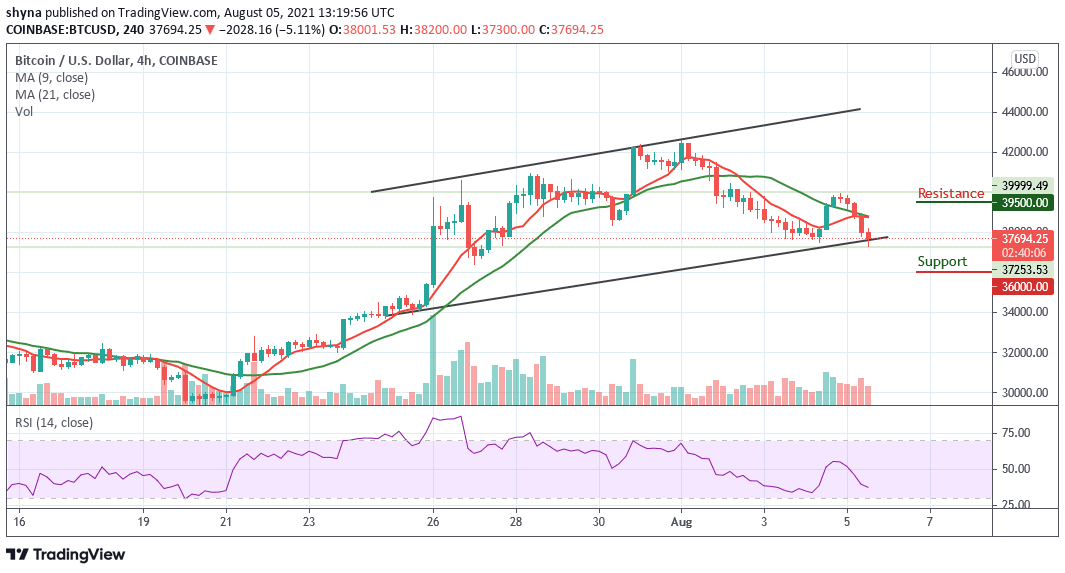
Moreover, if the bulls push the coin above the moving averages, BTC/USD could hit the resistance at $39,000 before heading to the previous resistance level of $39,500 and above. Meanwhile, the market is likely to follow a bearish trend as the technical indicator Relative Strength Index (14) moves to cross below 40-level.
Looking to buy or trade Bitcoin (BTC) now? Invest at eToro!
75% of retail investor accounts lose money when trading CFDs with this provider


