Bitcoin Price Prediction: BTC/USD Dips Below $30,000 Level

Bitcoin Price Prediction – July 20
The Bitcoin price is back under $30,000 since June 28 as the coin loses an important trend line that has supported the cryptocurrency’s uptrend.
BTC/USD Long-term Trend: Bearish (Daily Chart)
Key levels:
Resistance Levels: $34,000, $36,000, $38,000
Support Levels: $27,000, $25,000, $23,000
After losing momentum above the $31,000, BTC/USD is facing another decline as the coin is seen trading below the $30,000 support level. According to the daily chart, the Resistance above $31,000 has proven too strong for bulls to break, and bears are now pushing the Bitcoin price back down to retest support lower.
Bitcoin Price Prediction: Bitcoin Price May Touch $25,000 Level
Despite the risk of losing trade below the 9-day and 21-day MAs, that means the market will continue to experience a downward movement. However, the Bitcoin price was seen following a sideways movement at one point but since the 9-day MA is still below the 21-day MA, the dramatic downside may continue to materialize. Meanwhile, if the bulls push higher, the first level of resistance could be located at $32,000.
However, a sustainable move above $33,000 is needed for the upside to gain traction as further resistance levels could be located around $34,000, $36,000, and $38,000. On the other hand, the technical indicator Relative Strength Index signal line is now facing the down below 35-level, further bearish movement could drag the coin to the critical supports at $27,000, $25,000, and $23,000 respectively.
BTC/USD Medium-Term Trend: Bearish (4H Chart)
Looking at the 4-hour chart, the bears are back into the market, hovering below the 9-day and 21-day moving averages. The break below this crucial barrier causes it to plunge as low as $29,300, with bulls trying to guard against a decline beneath this level. Meanwhile, unless the Bitcoin (BTC) recaptures $30,000, the bears could have the upper hand over as the king coin may soon reel significantly lower.
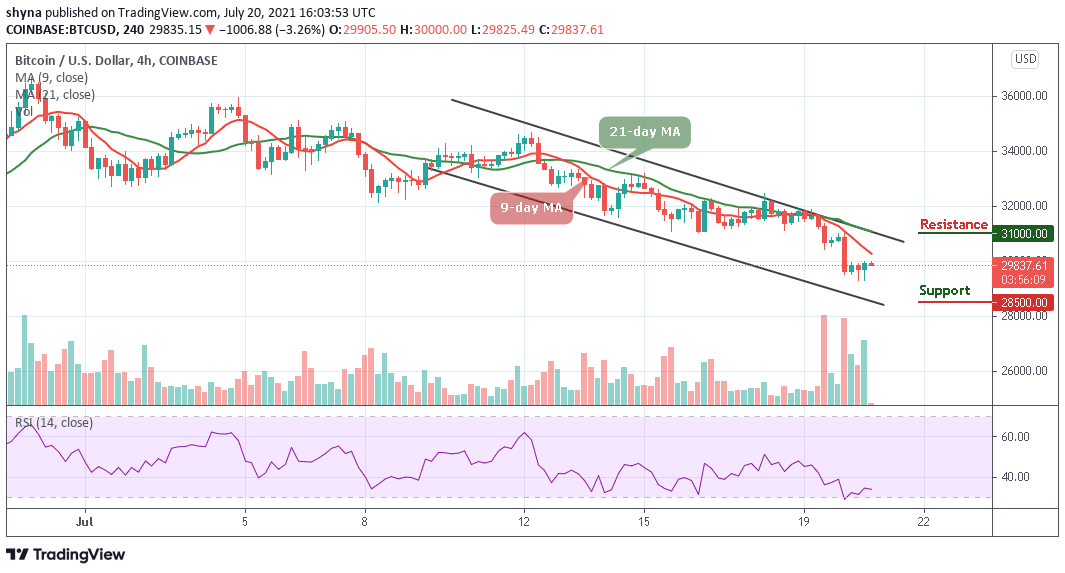
In other words, any further bearish movement towards the lower boundary of the channel could see the support level of $28,500 and below. Meanwhile, as the technical indicator Relative Strength Index (14) moves below 35-level, bearish signals may continue to play out. On the other hand, if the bulls push the coin upward, the potential resistance level lies at $31,000 and above.
Looking to buy or trade Bitcoin (BTC) now? Invest at eToro!
75% of retail investor accounts lose money when trading CFDs with this provider


