Bitcoin Price Prediction: BTC/USD Drops Below $35,000 Level

Bitcoin Price Prediction – June 30
The Bitcoin price is back under $35,000 after losing an important trend line that has supported the cryptocurrency’s uptrend.
BTC/USD Long-term Trend: Bearish (Daily Chart)
Key levels:
Resistance Levels: $40,000, $42,000, $44,000
Support Levels: $30,000, $28,000, $26,000
After losing momentum above the $36,000, BTC/USD is facing another decline as the coin crossing below the 9-day and 21-day moving averages. The Bitcoin price is seen trading below the $35,000 support level. However, the Resistance above $36,000 has proven once again too strong for bulls to break, and bears are now pushing the price per coin back down to retest support lower.
Bitcoin Price Prediction: Bitcoin Price May Follow Downside
Despite the risk of losing trade above the upper boundary of the channel, that doesn’t mean a downtrend will begin, or that the greater bull market is immediately over. The Bitcoin price continues to follow a sideways movement at one point, and although the 9-day MA is still below the 21-day MA, the dramatic downside may begin to materialize.
Looking at the daily chart, if the bulls push higher, the first level of resistance is located at $36,000. Therefore, a sustainable move above $38,000 is needed for the upside to gain traction while the next important resistance may come at $39,000. However, further resistance levels could be located around $40,000, $44,000, and $46,000 but as the technical indicator Relative Strength Index signal line moves below 50-level, the further bearish movement could hit the critical supports at $30,000, $28,000, and $26,000.
BTC/USD Medium-Term Trend: Bullish (4H Chart)
Looking at the 4-hour chart, the bears are seen coming back into the market price hovers around the 21-day moving average. The break below this crucial barrier may cause it to plunge as low as $34,000, with bulls stepping up and guarding against a decline beneath this level. Meanwhile, unless it recaptures $36,000 in the near term, the bears could have the upper hand over the bulls, and BTC/USD may soon reel significantly lower.
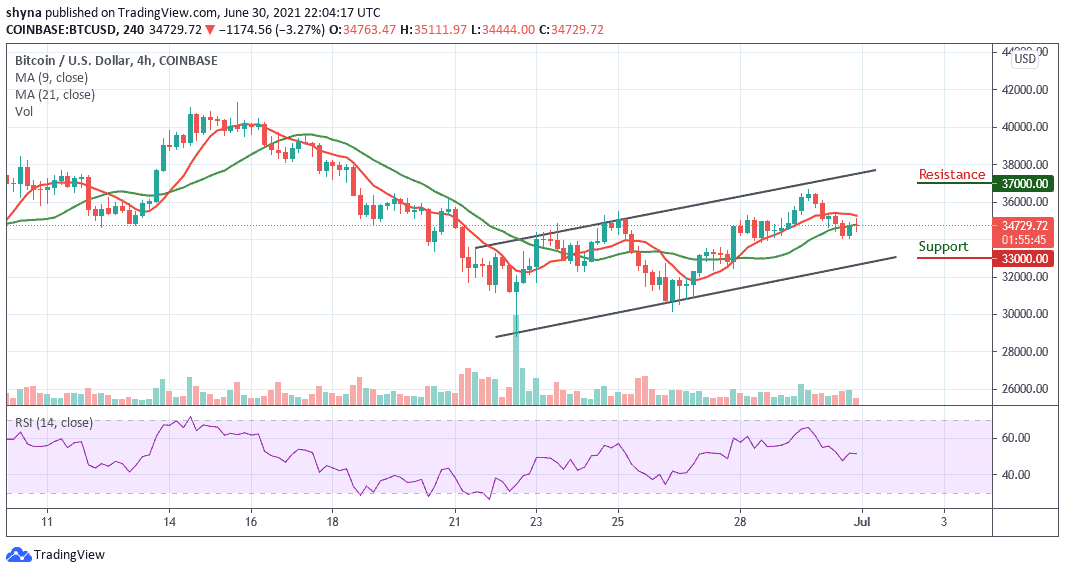
However, any further bearish movement below the 9-day and 21-day moving averages could see the support levels of $33,000 and below. Meanwhile, as the technical indicator Relative Strength Index (14) moves around 51-level, bearish signals could push the price towards the lower boundary of the channel. On the other hand, if the bulls push the coin upward, the potential resistance level remains at $37,000 and above.
Looking to buy or trade Bitcoin (BTC) now? Invest at eToro!
75% of retail investor accounts lose money when trading CFDs with this provider


