Bitcoin Price Prediction: BTC/USD Stumble Below $36,000

Bitcoin Price Prediction – June 5
The Bitcoin price path of least resistance remains below the 9-day and 21-day moving averages as the coin loses over $1000, dropping from $37,921 to $35,300.
BTC/USD Long-term Trend: Bearish (Daily Chart)
Key levels:
Resistance Levels: $44,000, $46,000, $48,000
Support Levels: $28,000, $26,000, $24,000
BTC/USD has been struggling to maintain its position above $37,000 and its price saw another dive below the $36,000 mark today. The Bitcoin price is in a dangerous position as the price slipped below the nearest support level of $37,000 during the European session. If the breakthrough is confirmed, the downside momentum will gain traction with the next focus on $35,000. At the time of writing, Bitcoin is trading below the 9-day and 21-day moving averages at $36,170 with a decline of 1.86% on the daily price chart.
Bitcoin Price Prediction: What is the Next for Bitcoin?
If the Bitcoin price rejects the higher resistance level, lower levels may be tested in a sequence of lower highs and lower lows until prices touch the next critical support level. However, the market may experience a lot of short-term based trades and a lot of volatility too as the technical indicator Relative Strength Index (14) moves below 40-level.
Meanwhile, it is important to note that the Bitcoin price is most likely to break south in as much as the 9-day MA remains below the 21-day MA, and its failure to hold the mid-range support level may pull the price down to its next support level at $30,000. Therefore, the short-term analysis indicates that BTC/USD may test higher levels with key resistance at $38,500 before a reversal and the resistance levels to watch are $44,000, $46,000, and $48,000 while the supports are located at $28,000, $26,000, and $24,000 respectively.
Looking to buy or trade Bitcoin (BTC) now? Invest at eToro!
75% of retail investor accounts lose money when trading CFDs with this provider
BTC/USD Medium – Term Trend: Ranging (4H Chart)
According to the 4-hour chart, BTC/USD has been facing immense turbulence throughout the past several days, with sellers forcing its price down to the lows of $35,734. If bulls decide to push the market price above the 9-day and 21-day moving averages, the coin may likely hit the resistance at $38,000 and above.
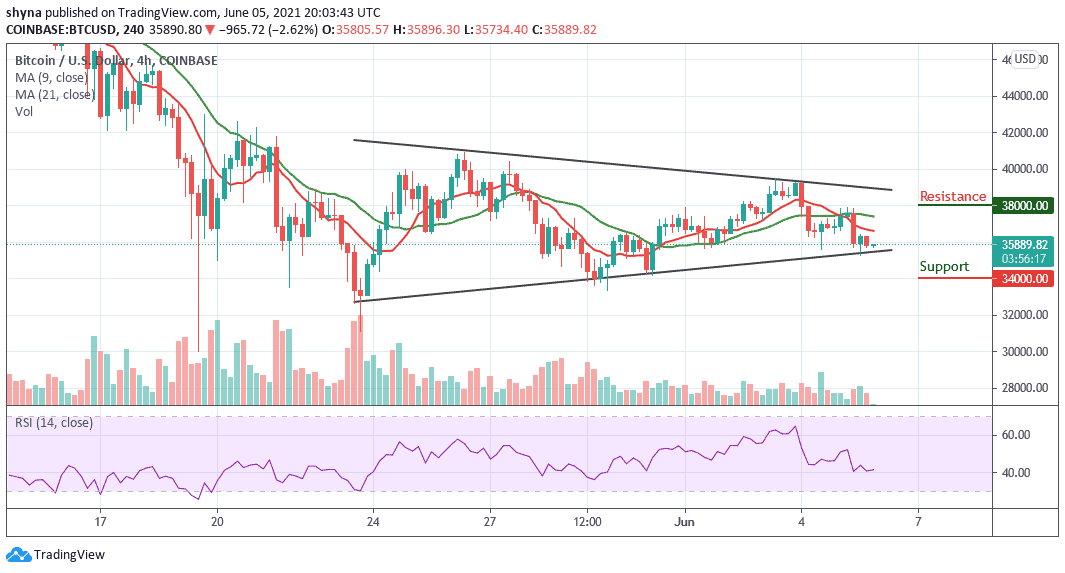
However, it now appears that the cryptocurrency is now ready for further upside in the near term, as the multiple attempts to shatter its $40,000 resistance seem to indicate that bears are building momentum. As the RSI (14) moves towards the east, any reversal may locate the critical supports at $34,000 and below.


