Ethereum Price Could Drop 11% Further To $3,528 – Sell ETH Now?

- Ethereum has turned bullish on Saturday with bulls determined to regain the $4,000 crucial level.
- Rising above $4K could take ETH above the upper boundary of the descending parallel channel at $4,042 level confirming a bullish breakout.
- Defending the 100-day SMA support at $3,926 is essential for a bullish breakout.
- The IOMAP model by IntoTheBlock shows that Ethereum price faces significant resistance upwards suggesting that the correction might continue towards $3,528 in the near term.
Ethereum (ETH) dropped below the 100 Simple Moving Average (SMA) around $3,920 on December 17, unravelling a possible bearish forecast. Although Ethereum price has since risen above the 100-day SMA, descending parallel channel chart pattern suggests that Ethereum could sink 11% deeper. To invalidate the pessimistic outlook, ETH would need to defend the 100-day SMA support.
Ethereum Turns Bullish On Saturday
ETH price has traded in two straight bearish sessions between Thursday and Friday this week. These bearish sessions extended the price correction that started on December 01. This price action has formed a descending parallel channel on the daily chart suggesting that Ethereum price could drop further.
However, Ethereum is currently trading in the green at $3,969 and appears to be battling immediate resistance from the $4,000 psychological level. A closure above this level could bolster the Ethereum bulls to push price higher above the $4,042 resistance embraced by the upper boundary of the descending channel.
A decisive bullish breakout will be achieved if Ethereum price closes above the aforementioned level, after which a move to tag the upper tip of the channel at $4,768 would become a possibility.
Note that the RSI and the MACD have started moving upwards adding credence to this bullish outlook.
ETH/Daily Chart
Ethereum price faces Stiff Resistance Upwards
Even if Ethereum’s pessimistic outlook described above plays out, ETH price may have to overcome so hurdles before reaching $4,768.
For example, Ethereum bulls have to first overcome the resistance provided by the 50-day Simple Movign Average (SMA) at $4,328. The next significant hurdle will be found around the $4,400, $4,500 and $4,600 psychological levels.
In addition, on-chain metric’s from IntoTheBlock’s In/Out of the Money Around price (IOMAP)model shows that Ethereum faces still resistance upwards. For example, the Ethereum IOMAP chart below shows that the immediate resistance around $4,000 is found within the $4,083 and $4,202 price range where approximately 9.8 million ETH were previously bought by roughly 1.95 million addresses.
These investors may want to breakeven curtailing any attempts to push the Ethereum price beyond this level.
Ethereum IOMAP Chart
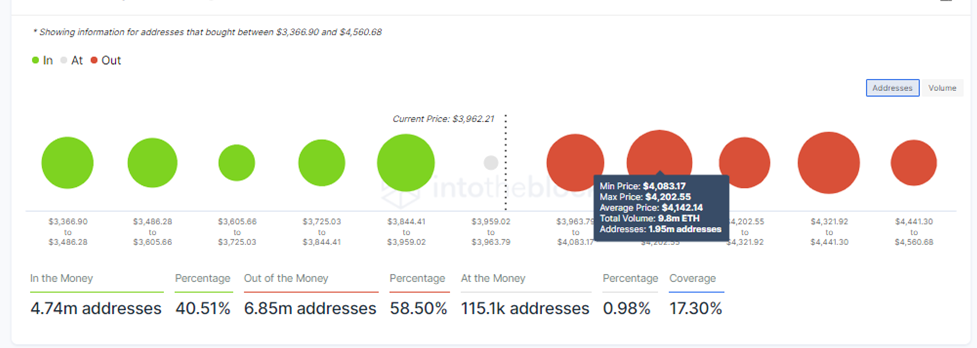
Ethereum IOMAP Chart by IntoTheBlock
On the contrary, the immediate support around $3,887 is within the $3,844 and $3,959, where approximately 3.86 million ETH were previously bought by $1.41 addresses. This support is not robust enough to absorb any selling pressure that might come from the investors who have bought ETH at higher prices.
Therefore, according to the IOMAP chart, the path with least resistance is downwards, suggesting a deeper price correction in the near-term.
Ethereum Price Correction May Continue as $3,528 looms
ETH price is trading just above the $3,926 support level embraced by the 100-day SMA. Failure to defend this support could see Ethereum drop to find support at the middle boundary of the descending channel at $3,785.
A drop below the aforementioned level could trigger sell orders that could see Ethereum drop further to reach the target of the prevailing chart patter at $3,528 embraced by the lower the lower boundary of the descending parallel channel. If this happens, ETH price will lose approximately 11% of its current value.
The down-sloping moving averages and the position of the Relative Strength Index (RSI) indicator at 44.11 suggest that Ethereum is firmly in the hands of the bears, accentuating this bearish outlook.
Moreover, the position of the Movign Average Convergence Divergence (MACD) indicator below the zero line in the negative region shows that the Ethereum price market sentiment is bearish at the moment.
Do you want to Sell Your ETH Now?
If you want to sell ETH given the bearish outlook described above, you can do so on some of the leading crypto trading platforms such as eToro. eToro supports unique features such as copy trading that allows a new trader to copy the trading strategy used by an expert trader. It also charges low trading fees and commissions.
Looking to buy or trade Ethereum (ETH) now? Invest at eToro!
Your capital is at risk
Read more:
- How to buy Ethereum cryptocurrency
- How to buy Bitcoin
- Where to Buy Ethereum (ETH)


