XRP Price Prediction: XRP/USD Price Struggles, Pushing Northward

XRP Holds Sideway Moves – August 11
After a notable line of sideways movement, the Ripple XRP/USD price struggles to push northward above the upper range zone at $0.80. The crypto’s current percentage rate is seen at 4.61, trading around the line of $0.89.
Holds Sideway Moves: XRP Market
Key Levels:
Resistance levels: $1.00, $1.20, $1.40
Support levels: $0.70, $0.60, $0.50
XRP/USD – Daily Chart
It is depicted on the Ripple XRP/USD daily chart that the crypto’s price struggles, pushing northward. A smaller bullish candlestick emerged during the August 7th session to stem the pushes beyond the recent resistance at $0.80. The 50-day SMA trend-line is around the point earlier mentioned as the 14-day SMA trend-line points to the north close below it. And, the bearish trend-line drew to place a markdown at the line breached slightly northward. The Stochastic Oscillators are slantingly placed northbound around the range of 80 to suggest that some degrees of buying pressures are ongoing.
Will the XRP/USD market increase more as price struggles, pushing northward?
In the first place, the Ripple XRP/USD market is undervalued as now that price struggles, pushing northward toward $0.90. Based on that, it could be that the crypto economy has a brighter chance to increase more until the subsequent sessions. An interception of the 50-day SMA indicator by the 14-day SMA indicator from underneath will signal that the upward pressures will potentially dominate most of the positions afterward.
On the downside, the next probable barrier trading zone that the Ripple XRP/USD bears may have to be on the lookout around the resistance at $1.00. A forceful breakout of that point will decimate the assumption as the market may advance to a higher value, making shorting entry difficult. Being as it is, points between $0.80 and $1.00 are crucial to determine the subsequent trading situation of the crypto trade.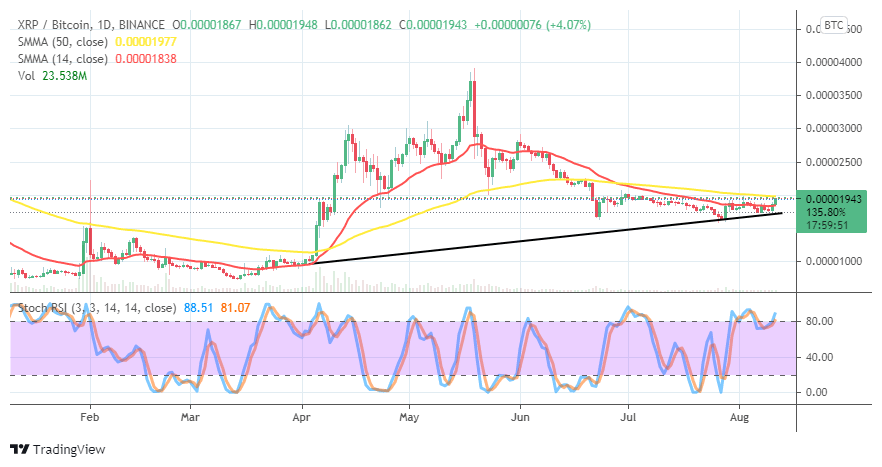
XRP/BTC Price Analysis
The Ripple XRP, as the base crypto now struggles, pushing northward against Bitcoin, as the counter crypto. That shows that the former trading tool has begun to regain the trending weight as paired with the latter crypto. The 14-day SMA indicator moves closer beneath the 50-day SMA indicator as there is a formation of a bullish candlestick between them, seemingly striving to break upward against the bigger SMA. The bullish trend-line drew underneath the SMAs in a supportive format to the crypto economy. The Stochastic Oscillators have re-crossed the line at range 80 to the north. That signifies that more upward motions will come in favor of XRP as compared with BTC.
Looking to buy or trade XRP (XRP) now? Invest at eToro!
75% of retail investor accounts lose money when trading CFDs with this provider


