Bitcoin (BTC/USD) Market Shows Recovery Signal

Bitcoin Price Prediction – July 21
The BTC/USD market now shows a recovery signal after responding positively to a line of downward forces in the recent sessions. The crypto’s valuation trades around $31421 at a percentage rate of 4.25.
BTC/USD Market
Key Levels:
Resistance levels: $35,000, $37,500, $40,000
Support levels: $27,500, $25,000, $22,500,
BTC/USD – Daily Chart
The BTC/USD daily chart has it that the crypto market shows a recovery signal by the current emergence of a bullish candlestick bottoming upon the critical support baseline drawn at $30,000. The 14-day SMA indicator has moved down past the level of $35,000 beneath the 50-day SMA indicator. The Stochastic Oscillators are in the oversold region, pointing toward the northbound near the range of 20. That indicates that the market is getting set for momentum recovery.
Could the current upswing be counted upon as the BTC/USD market shows a recovery signal?
Considering the trading point where the BTC/USD market shows a recovery signal on the daily trading chart, traders could count upon the emergence as today’s bullish candlestick is bottoming upon the critical support baseline presently. The end-point of the current candlestick as being bullish would potentially lead this market operation into projecting further for northward motion. The market’s upsurge may face resistance around $33,000 or thereabout.
On the downside of technical analysis, it would be more advisable that bears should suspend placing of positions until a while. The reason for that assumption isn’t far-fetched than being that the crypto economy has reached a downward zone denoting visible over-stay of bears’ strength in the market. Therefore, shorting of positions as of this time could in no time nudge such trading stance into bears’ trap.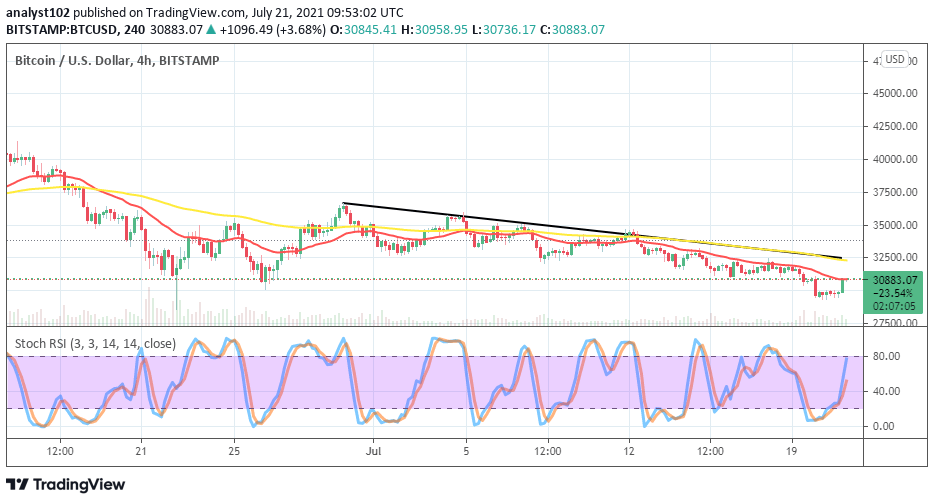
BTC/USD 4-hour Chart
A bullish candlestick has emerged on the BTC/USD medium-term chart to denote that the crypto market shows a recovery signal, aiming to form against the trend-line of the smaller SMA. The bearish trend-line drew alongside the 50-day SMA indicator above the 14-day SMA indicator. The Stochastic Oscillators have moved from the oversold region to point northbound closely below the range of 80. That signifies that the BTC/USD bulls are getting prepared, mustering muscles against the US Dollar’s worth in the crypto trading space.
Looking to buy or trade Bitcoin (BTC) now? Invest at eToro!
75% of retail investor accounts lose money when trading CFDs with this provide


