Bitcoin Cash Price Prediction: BCH/USD Trade Upsurges Relatively

BCH Trade Upsurges Relatively r – July 26
The BCH/USD trade upsurges relatively to mark a new valuation uprising in the crypto economy. Price trades around the point of $503 at about 10.49 percentage rate increases.
Trade Upsurges Relatively: BCH Market
Key Levels:
Resistance levels: $600, $800, $1,000
Support levels: $400, $300, $200
BCH/USD – Daily Chart
The BCH/USD daily trading chart reveals that the crypto trade upsurges relatively, breaking through a line of small barriers in the ranges of $400 and $600. The critical support baseline remains drawn at the level of the lower point earlier mentioned. The 50-day SMA trend-line is around the bigger-value latterly mentioned above the 14-day SMA between those two points. The bearish trend-line drew downward across the SMAs to touch the smaller SMA on the buy signal side. The Stochastic Oscillators are in the overbought region, suggesting that the base crypto may soon be weak.
Will there be a breakout at the $600 upper range line as the BCH/USD trade upsurges relatively?
There can only be a successful breakout at the $600 upper range line if bulls beef up more energy as the BCH/USD trade upsurges relatively. A rejection of the current upsurge approaching or an eventual testing of the range line earlier mentioned may pave the way back to the downside. Whilst that scenario gets heightened the previous critical support line that is equally referred as the lower range line will be in focus.
Talking about the downside analysis of this crypto market, a point around $500 or $600 has to face resistance even as the crypto trade upsurges relatively to the north in a steady manner. In the event of the market witnessing a consolidation moving pattern at that capacity level, it would then technically sound well to stay out of placing any position for a while to know the exact direction that will feature.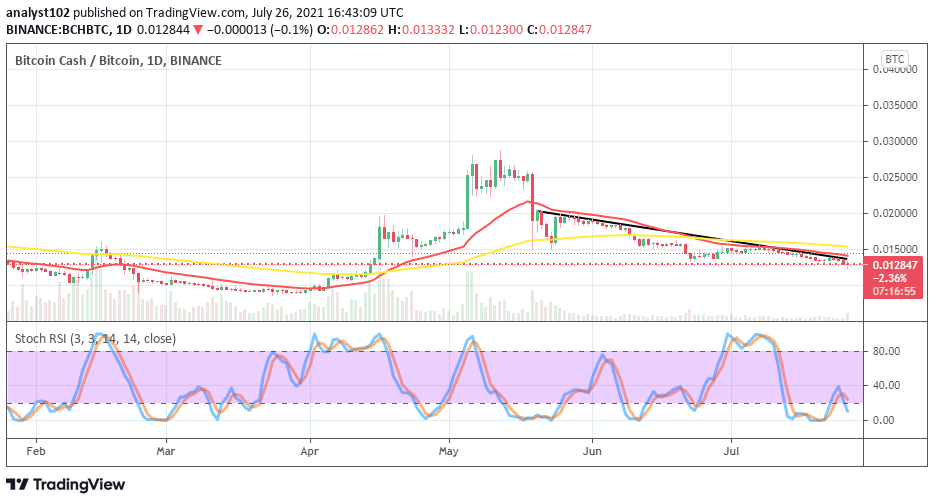
BCH/BTC Price Analysis
The trending weight of Bitcoin Cash compared with Bitcoin still shows on the price analysis chart that the base crypto is somewhat losing grand against the counter trading instrument. In other words, trade upsurges relatively aren’t seen between the two cryptos. The bearish trend-line drew alongside the 14-day SMA underneath the 50-day SMA. The Stochastic Oscillators had initially moved from the oversold region. But, they have now crossed the lines southbound between the ranges of 40 and 20. That suggests that BCH may soon be facing a difficult-trending situation as paired with Bitcoin.
Looking to buy or trade Bitcoin Cash (BCH) now? Invest at eToro!
75% of retail investor accounts lose money when trading CFDs with this provider.


